

Four forces are quietly rewriting the assumptions embedded in most long-term portfolios. None of them are new ideas. What is new is that 2026 turned each one from a slow-moving thesis into a measurable, investable fact.
Megatrends earn the label only when they stop being a talking point and start showing up in balance sheets, budgets, and bottlenecks. This year, four did exactly that — and they are not four separate stories. They share root causes and are co-dependent. In several cases one megatrend is quietly the mechanism that resolves, or worsens, another.
1. Power Is the New Bottleneck — Not Chips
The AI capex debate has been focused on compute. However, that is no longer where the real constraint sits. The IEA’s Electricity 2026 report projects global data centre electricity demand rising from 415 terawatt-hours in 2024 to 945 terawatt-hours by 2030 — a near-doubling, growing at roughly four times the pace of overall electricity demand. Meeting it requires annual grid investment to rise by about 50% by 2030, from a current base of $400 billion a year.
Global Data Centre Electricity Demand, 2024 vs 2030
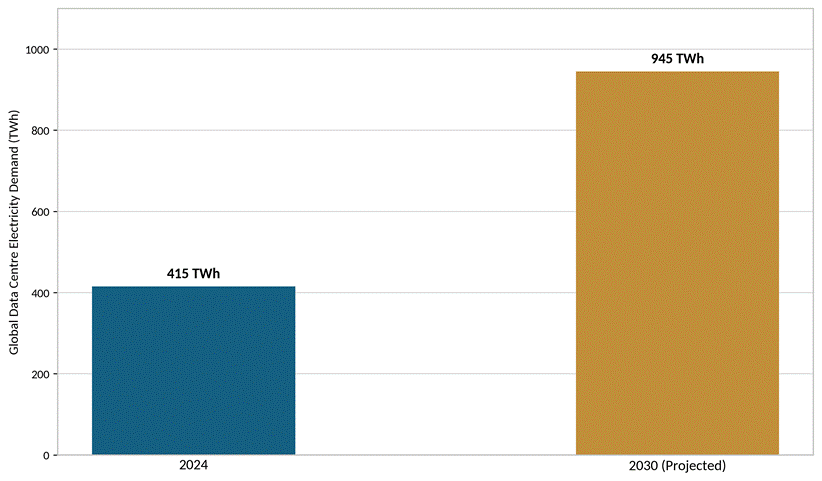
Source: International Energy Agency, Electricity 2026.
Goldman Sachs Research puts the US-specific number even more starkly: data centre power demand is forecasted to jump from 31 gigawatts in 2025 to 66 gigawatts by 2027. The limiting factor is not GPU supply. It is the grid interconnection queues that are now running four to ten years, high-voltage transformer shortages, and permitting timelines that were never designed for concentrated, gigawatt-scale loads.
This has a direct implication for the AI capital expenditure gap. This gap will not simply close because monetisation catches up. It will only close when power availability physically catches up with how fast capacity can be built — a different, less comfortable resolution than the one most AI-bull cases assume.
2. The Demographic Inversion Is Now a Balance Sheet Item, Not a Forecast
The United Nations’ 2024 World Population Prospects puts the global total dependency ratio — dependents per 100 working-age people — at 52.5 in 2010, rising to a projected 54.7 by 2030 and 59.1 by 2050. Meanwhile, global life expectancy is projected to rise from 73.3 years in 2024 to 77.4 by 2054. By 2080, people aged 65 and older will outnumber children under 18 globally for the first time in recorded history.
Global Total Dependency Ratio, 2010–2050
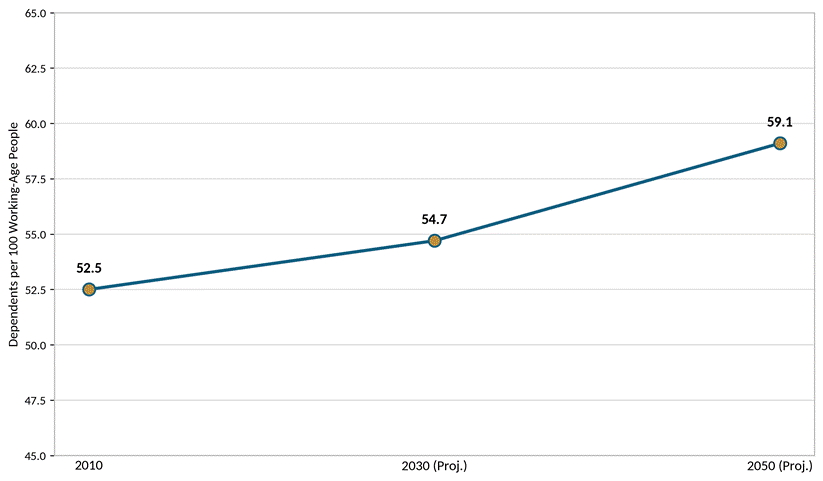
Source: United Nations, World Population Prospects 2024, Department of Economic and Social Affairs, Population Division.
This is not a uniform story, and treating it as one is the most common allocation error it produces. The inversion is concentrated in developed markets and China. Large parts of emerging Asia — India, Vietnam, Indonesia — retain favourable working-age demographics well into the 2040s. That divergence is not a coincidence sitting alongside the two-speed growth pattern, but one of the root causes of it.
The conventional offsets to an ageing workforce are immigration and automation. Immigration is politically constrained almost everywhere in 2026, which leaves automation and AI-enabled productivity capital carrying more of the adjustment than either policymakers or most portfolios are currently pricing in.
3. Fiscal Dominance Is Returning — and in the US, the Warning Signs Are No Longer Hypothetical
The IMF’s April 2026 Fiscal Monitor projects gross global government debt will reach 100% of global GDP by 2029 — one year earlier than the Fund’s own prior forecast. Global interest payments have risen to nearly 3% of global GDP, up from about 2% just four years ago. Twenty three economies now carry general government debt above 100% of GDP, led by Japan at 204%, Italy at 138%, and the USA at 126%.
Global Interest Payments as a Share of Global GDP, 2022 vs 2026
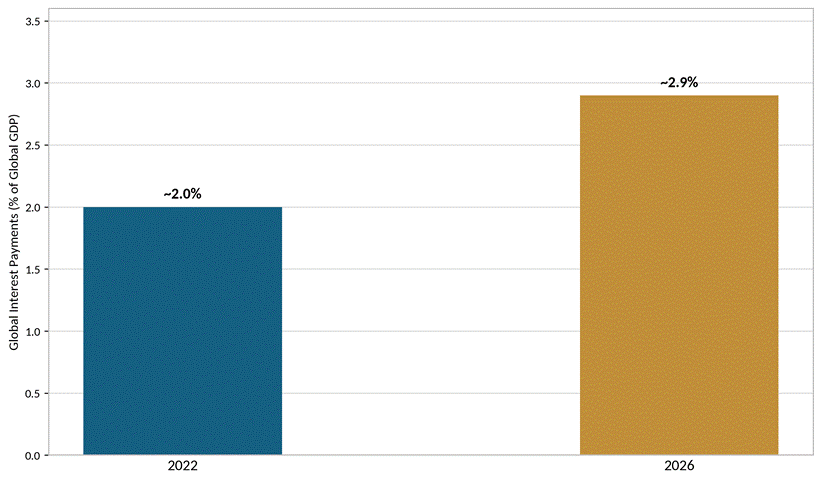
Source: IMF, Fiscal Monitor, April 2026.
The level of debt is not, by itself, the newest part of this story — developed economies have carried high debt loads before. The growing worry is that the interest costs are now the fastest-growing line item in many national budgets, consuming the fiscal room governments would otherwise have to respond to the next shock. Even excluding concerns for the next shock, how can economies maintain its balance sheet and budget?
The US Downgrade Cycle Is Now Complete
For the first time in modern financial history, none of the three major credit rating agencies rates US sovereign debt at the top tier. S&P downgraded the US in 2011. Fitch followed in 2023. Moody’s downgraded it to Aa1 in May 2025, citing growing debt and interest payment ratios “significantly higher than similarly rated sovereigns.” Moody’s own modelling behind that decision projects US federal debt rising from 98% of GDP in 2024 to 134% by 2035, on persistent annual deficits near 7%of GDP, and forecasted to widen to 9% by 2034.
Dollar Dominance Is Eroding at the Margin, Not Collapsing
The USD as reserve-currency data tells a consistent, if quieter, version of the same story. The IMF COFER data shows the dollar’s share of global central bank foreign exchange reserves has fallen from a peak of roughly 72% in 2001 to below 57% as of the third quarter of 2025 — the lowest level since 1995.
Central banks bought 863 tonnes of gold in 2025 alone, the fourth-largest annual expansion on record. The World Gold Council projects a further 750 to 850 tonnes in 2026. Gold has, by some measures, overtaken US Treasuries as a share of central bank reserves for the first time since 1996.
US Dollar Share of Global Central Bank Reserves, 2001 vs 2025
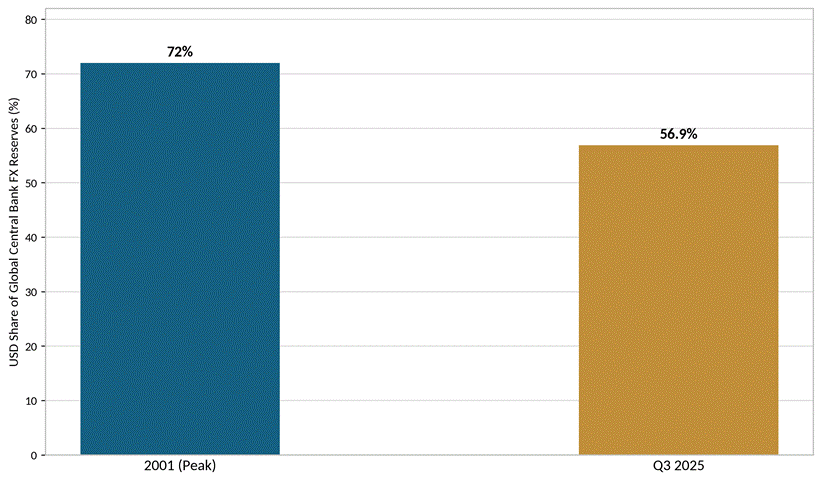
Source: IMF, Currency Composition of Official Foreign Exchange Reserves (COFER), Q3 2025.
This is not a dollar-collapse narrative, and treating it as one would be a mistake with real cost attached. The dollar remains, by a wide margin, the dominant settlement and reserve currency. No rival currently has the market depth, liquidity, and network effects to replace it at scale. The euro lacks a unified fiscal union and a comparably deep safe-asset market, while the renminbi is still constrained by capital controls. Gold carries no yield and cannot settle cross-border trade.
What is under way is a slow, structural redistribution at the margin among reserve managers, not a regime change. Important to note is that a redistribution that has been consistent and accelerating for four consecutive years is no longer noise. It is a trend a family office balance sheet should be pricing, even if it should not be panicking about it.
What This Means for Family Office Positioning
The historically costly mistake in this kind of environment has been mistiming an exit from dollar assets, not staying diversified through one. The more defensible response is to stop treating “home currency” as a synonym for “safe” and to build the portfolio as if that assumption could be wrong.
- Maintain a structural allocation to gold and other non-sovereign real assets sized to the family’s risk tolerance, not to recent price momentum. Central banks globally are already doing this at the reserve level, and it is worth asking why a family balance sheet would do less
- Diversify currency exposure across a basket of reserve and commodity-linked currencies, rather than concentrating funding, custody, and liabilities in a single currency, even the dollar
- Favour shorter-duration and floating-rate exposure in the sovereign debt of the most fiscally stretched issuers, where rising term premiums and further downgrade risk are asymmetric to the downside
- Treat real assets — infrastructure, real estate, select commodities — as a hedge against currency and fiscal-dominance risk specifically, not only against inflation
- Stress-test the portfolio explicitly against sustained dollar weakness occurring alongside higher US term premiums, rather than assuming the two are mutually exclusive
None of this argues for exiting the dollar. It argues for no longer treating it as the default answer to every currency question a family office portfolio asks.
4. Supply Chains Are Being Redrawn, Not Reshored
The political narrative and the construction data have diverged sharply in 2026. Despite repeated claims of “the largest reshoring wave in American history,” IoT Analytics’ industrial data shows US manufacturing construction spending has declined steadily since 2024, driven by a 44% slowdown in electronics and semiconductor fab spending specifically. Strip out electronics, and spending is up a modest 5.6% since tariffs began — real, but far short of a boom.
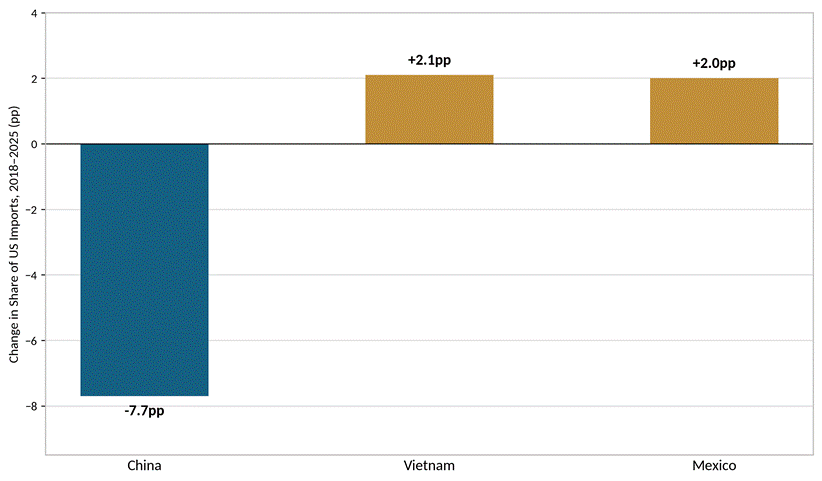
Change in Share of US Imports by Country, 2018–2025
Source: Bank of America Institute, “Battle of the Titans: Reshoring vs. Friendshoring.”
What is actually happening is more precise than reshoring: selective diversification. China’s share of US imports has fallen 7.7% since 2018, with Vietnam gaining 2.1% and Mexico 2.0%. The average US tariff rate hit 11.2% in 2025, and businesses absorbed roughly 80% of that cost last year. It will not be surprising to see that ratio flip through 2026 as pass-through to consumers accelerates due to inflation stickiness.
这对投资组合构建意味着什么
These four forces are not independent risks to be diversified away from each other. They are, to a meaningful degree, the same underlying shift viewed from four different balance sheets.
- Power generation, grid equipment, and nuclear capacity now offer a more durable form of AI-adjacent exposure than the chip layer alone. They are the binding constraint rather than a beneficiary of demand.
- Demographic-favourable allocations to emerging Asia are a structural position, not a tactical overweight.
- Currency and sovereign-duration exposure warrant the specific hedges set out above, sized to the family’s own liabilities and time horizon rather than applied uniformly.
- Inflation-linked and real-asset exposure should account for tariff pass-through arriving in consumer prices through 2026 and 2027, not the disinflation base case that held through 2024
关键要点
None of these four megatrends is new as an idea. What changed in 2026 is that each one stopped being separable. Each megatrend is co-dependent, and provides the opportunity and constraint for the others.
- The power constraint may be what finally resolves the AI capex gap.
- The demographic inversion explains the two-speed growth story.
- The fiscal situation is a result of the need for more spending to drive growth and to redraw supply chains. Notably, how the USA manages its budget and balance sheet, in turn, correlates to the erosion of dollar reserve share that has a material impact to the rest of the world.
- The reshoring narrative and the AI infrastructure boom turn out to be the same construction spending wearing different names.
The portfolios best positioned for what comes next are not the ones that bet on any single megatrend. They are the ones built on the recognition that these four are actually one and co-dependent.
#Megatrends #GlobalMarkets #AssetAllocation #FamilyOffice #InvestmentOutlook #FTCPInsights